
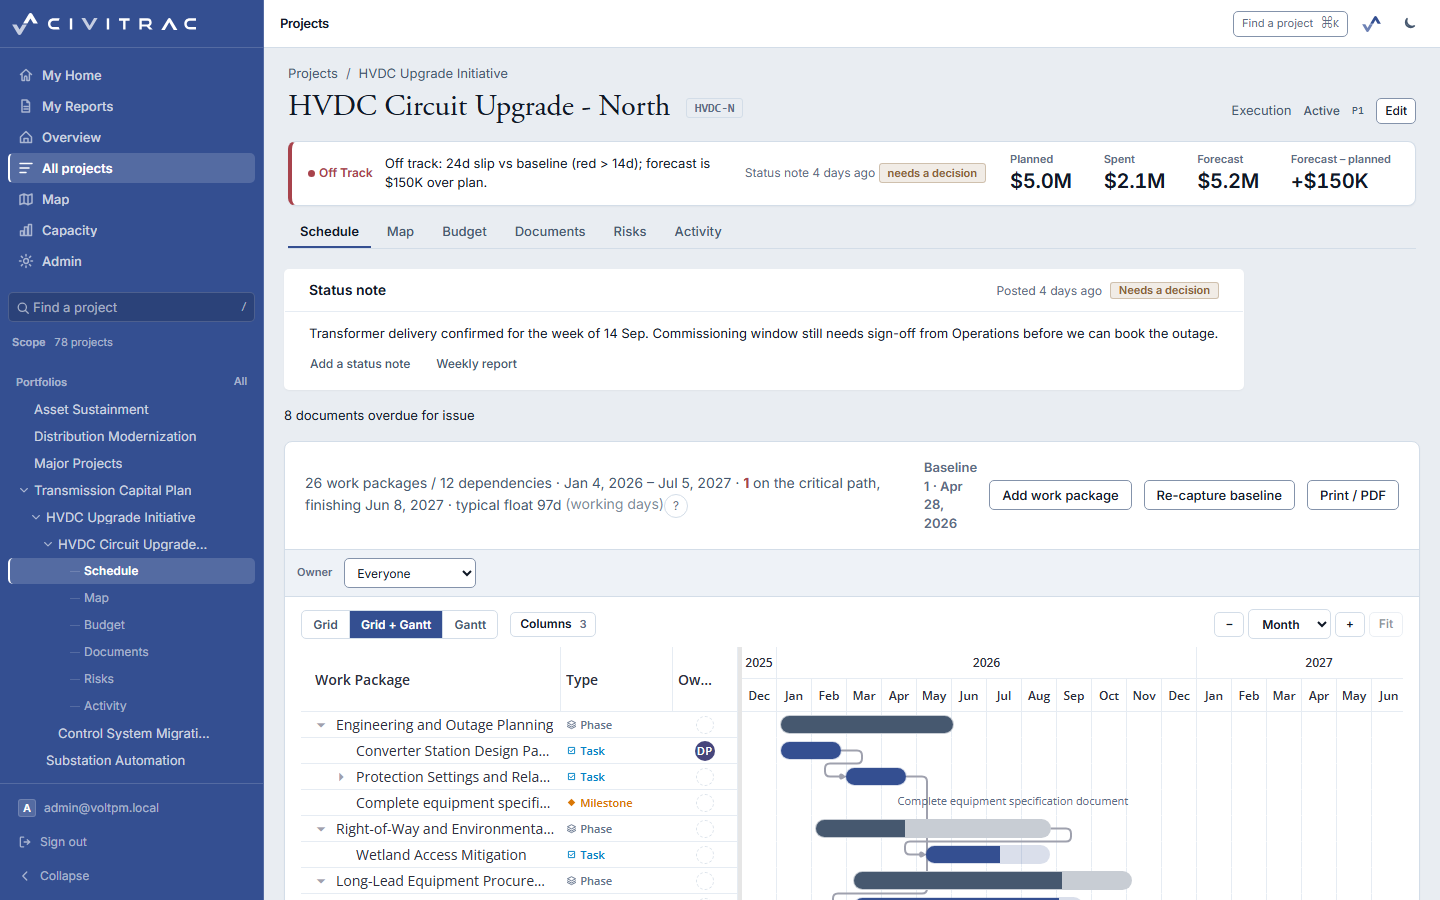
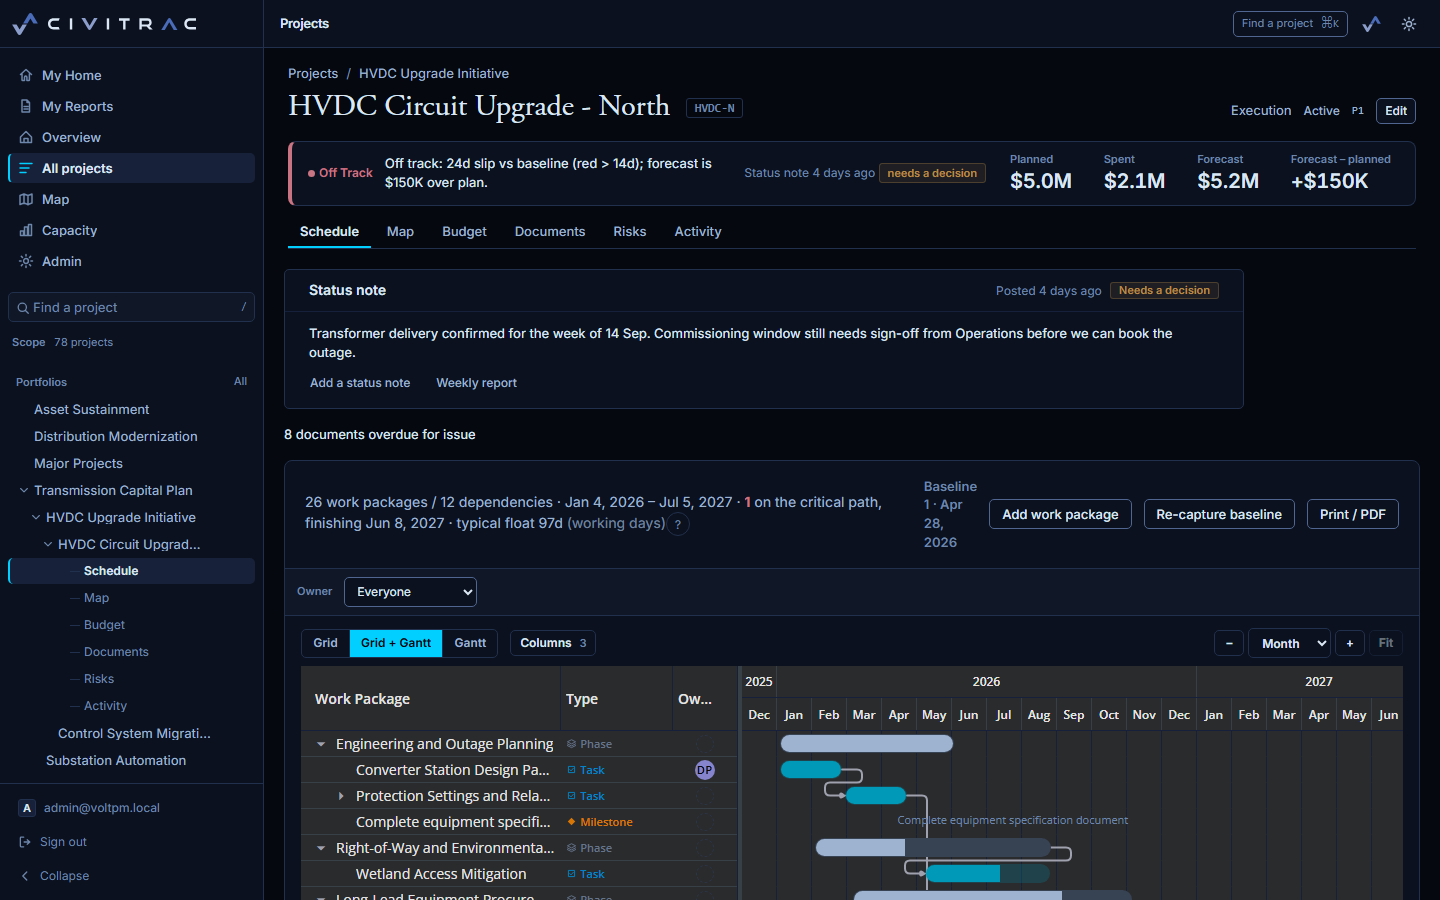
The plan, and the path through it
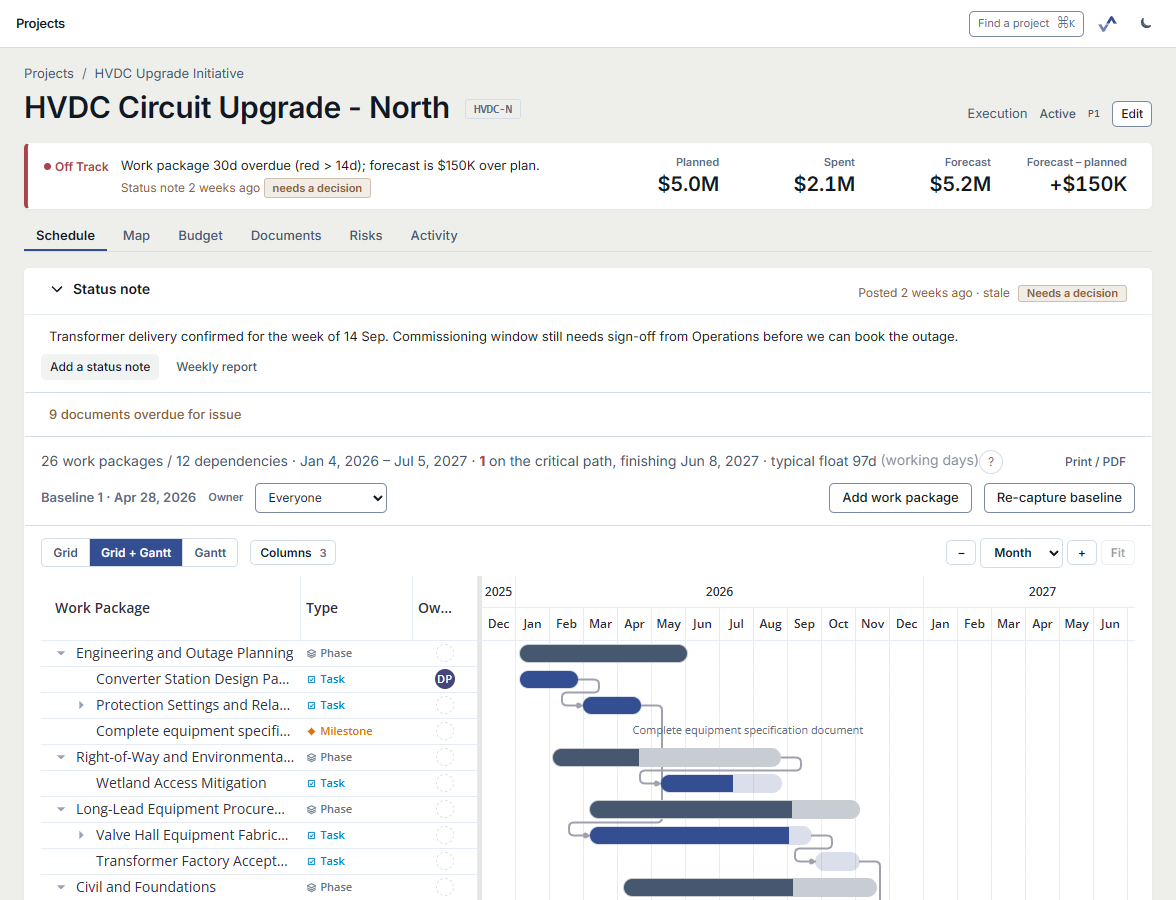
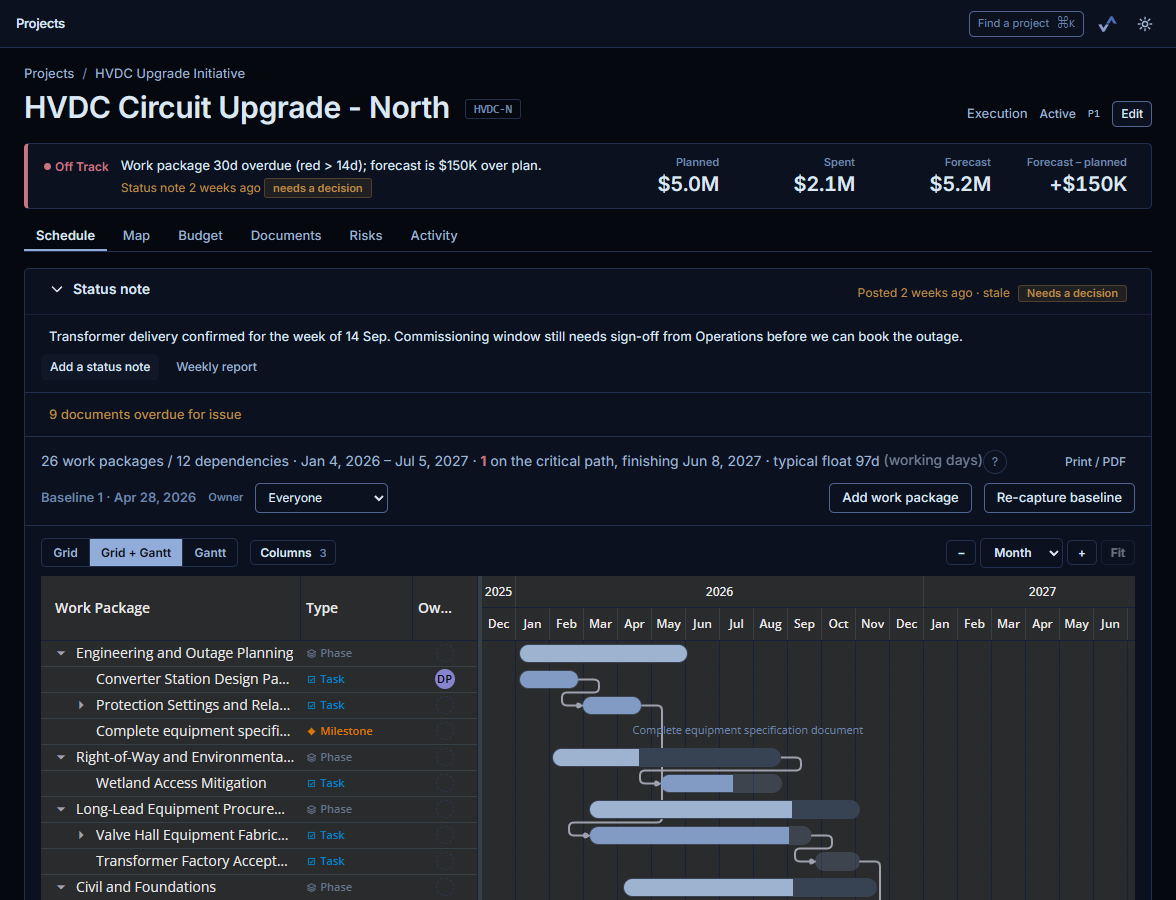
Work packages beside the gantt, dependencies drawn, and the baseline every date is measured against.
Infrastructure in focus
Schedules, budgets, drawings and risk for transmission, substation and civil programs, kept in one register.
Work packages beside the gantt, dependencies drawn, and the baseline every date is measured against.
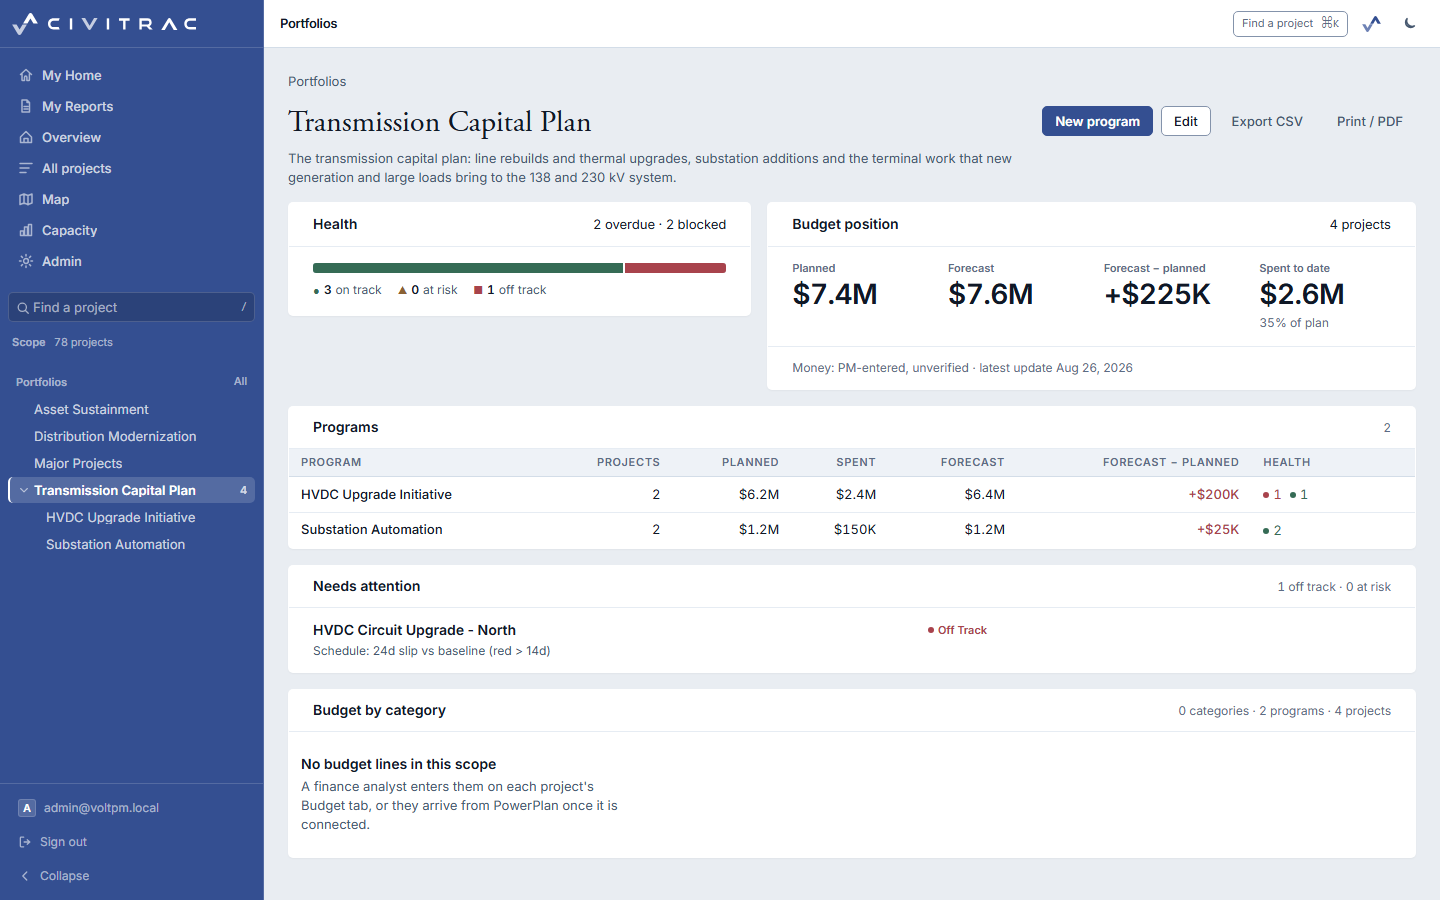
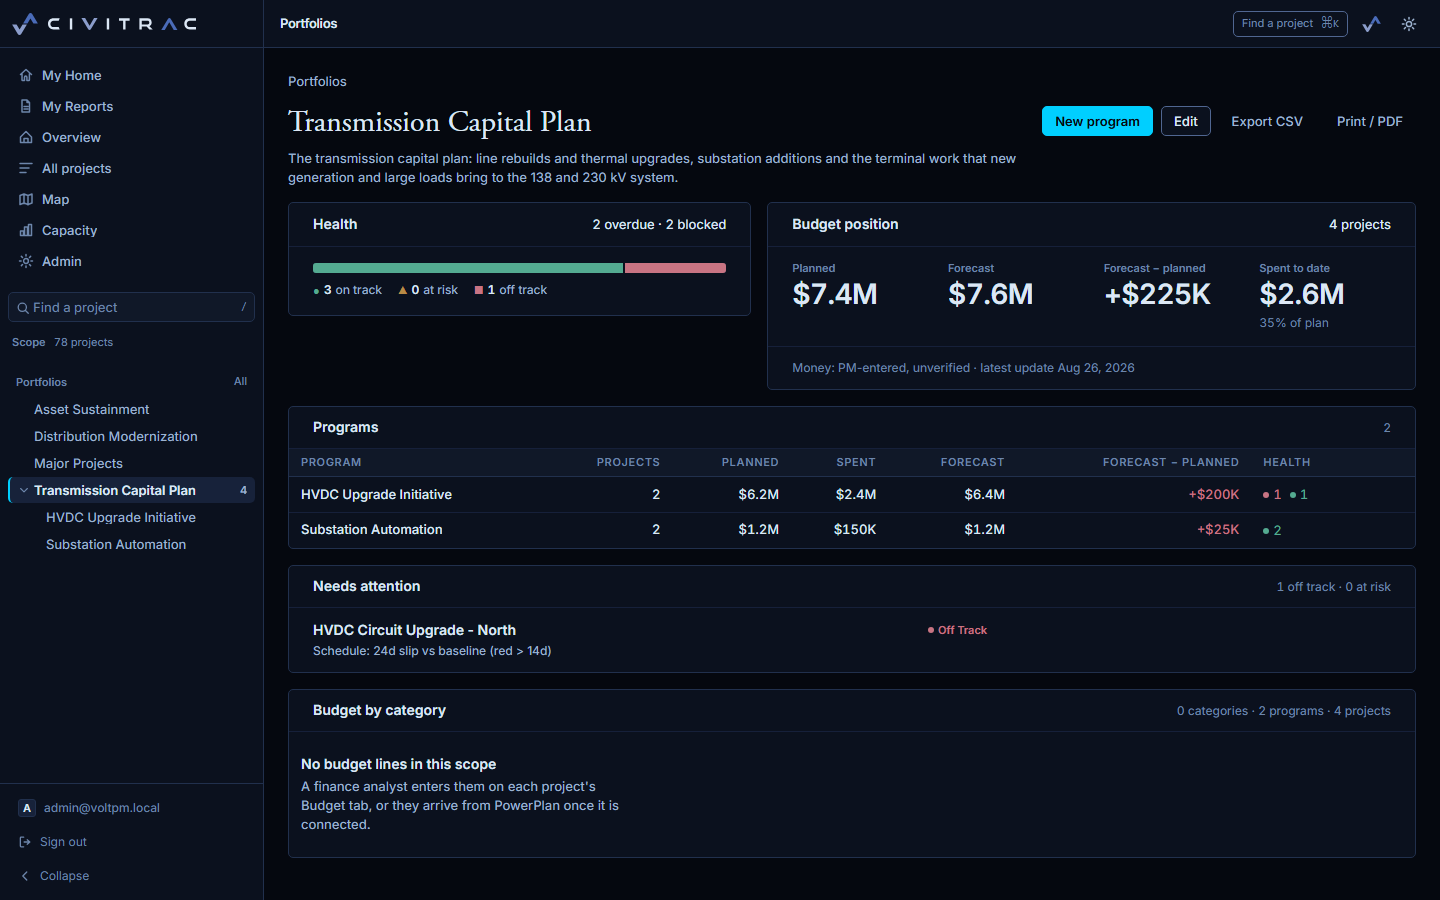
Every program and project rolled up, health and budget a line each, so a slip shows before the field reports it.
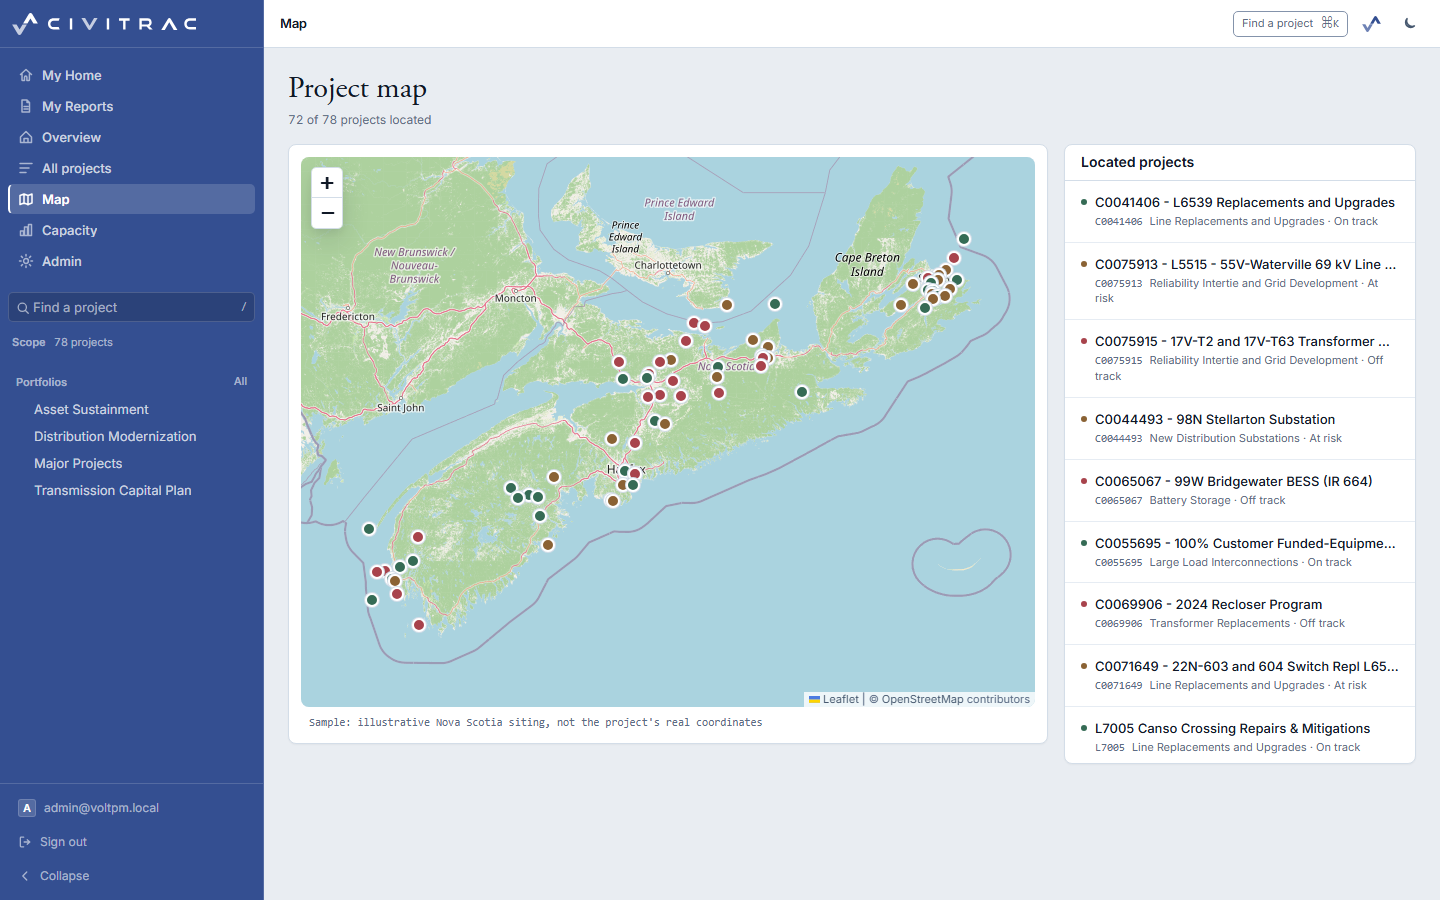
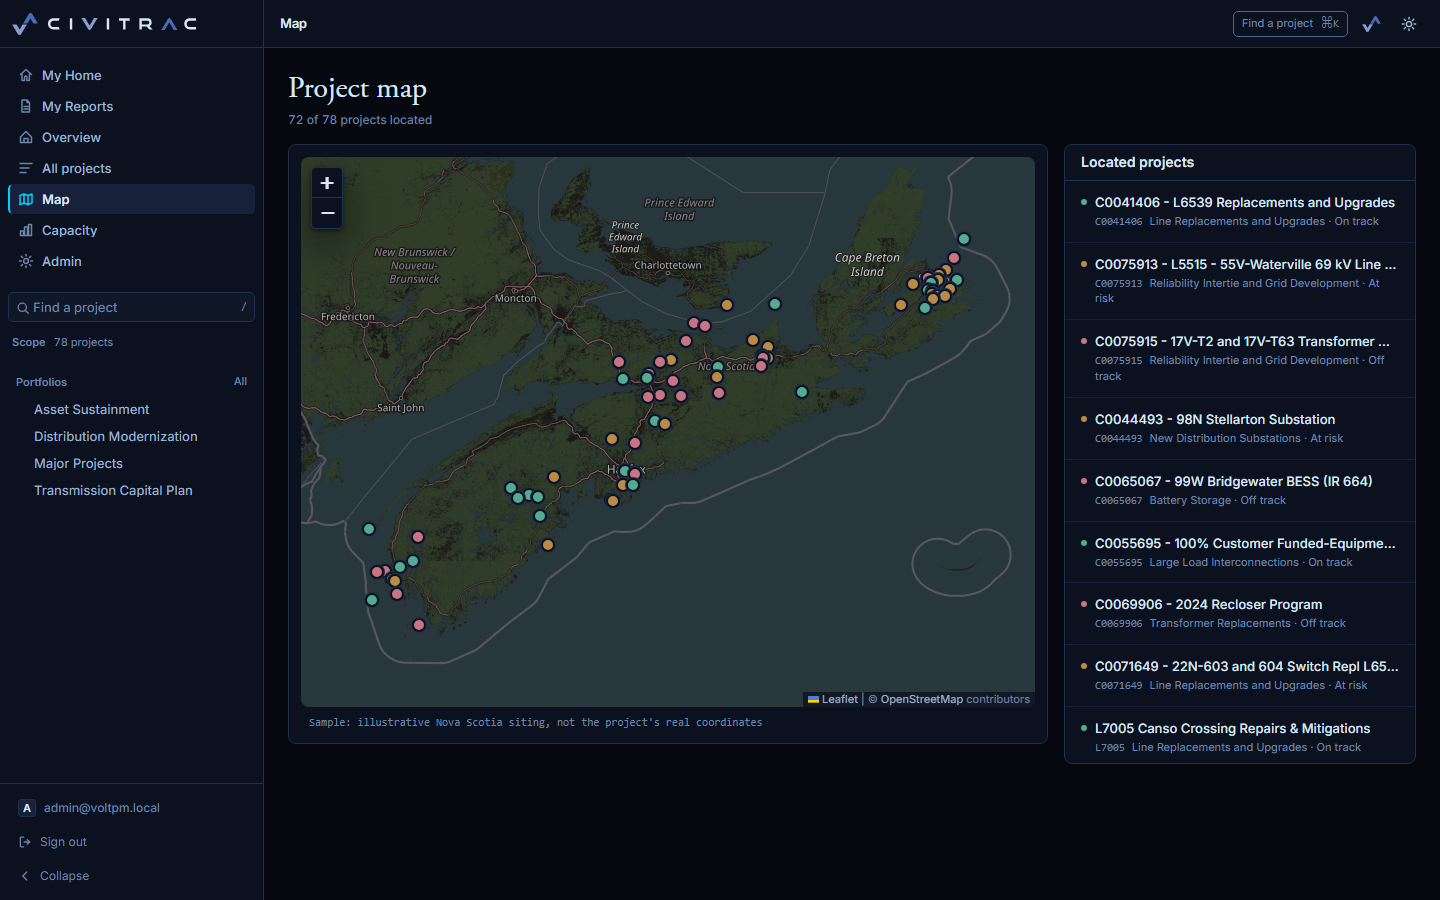
Projects placed where the work is, so the load across a region reads at a glance.
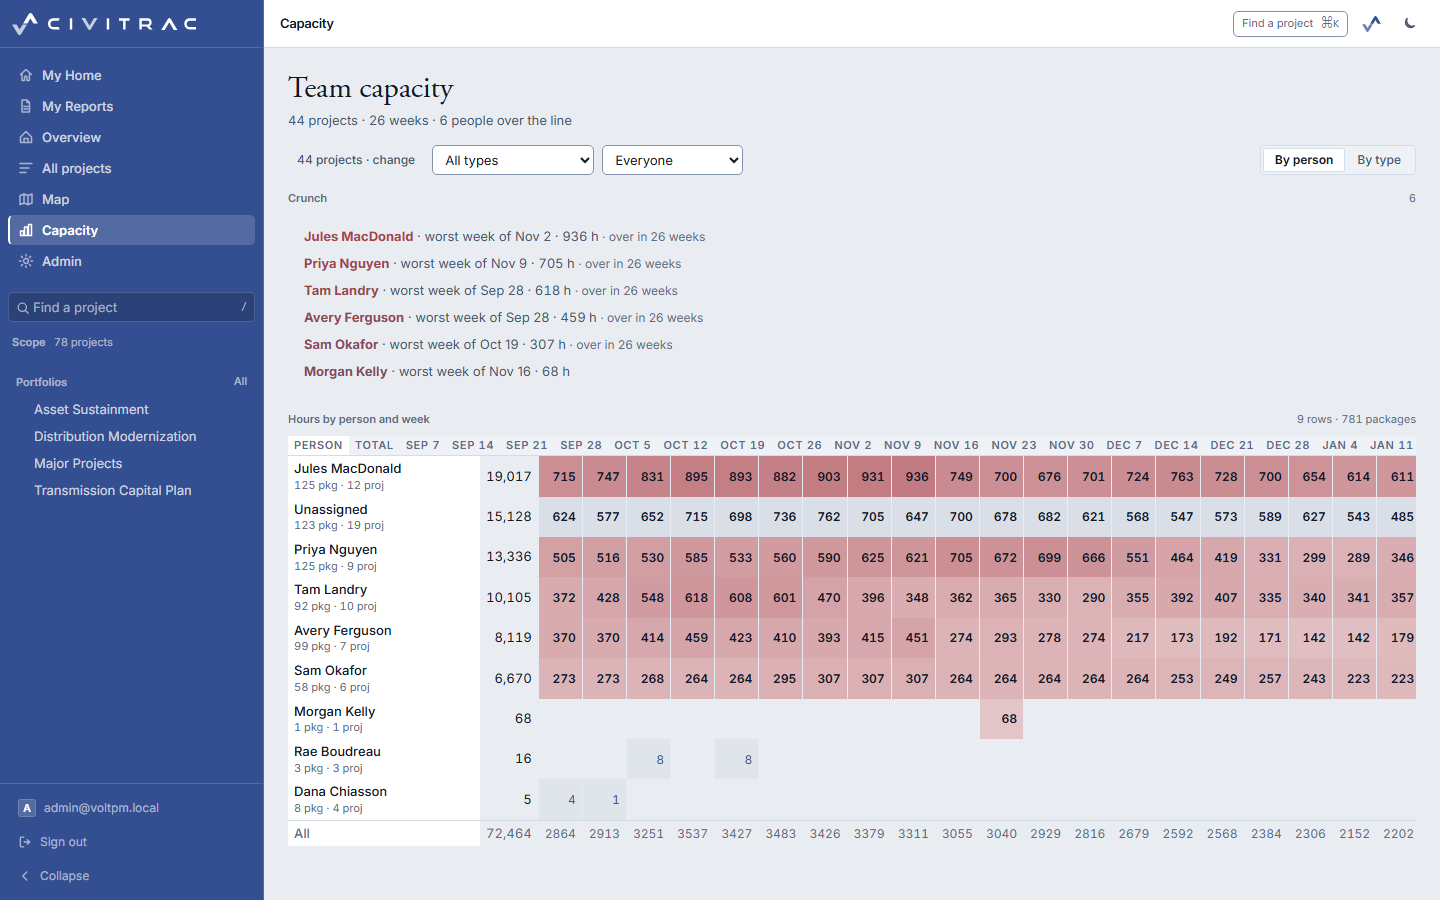
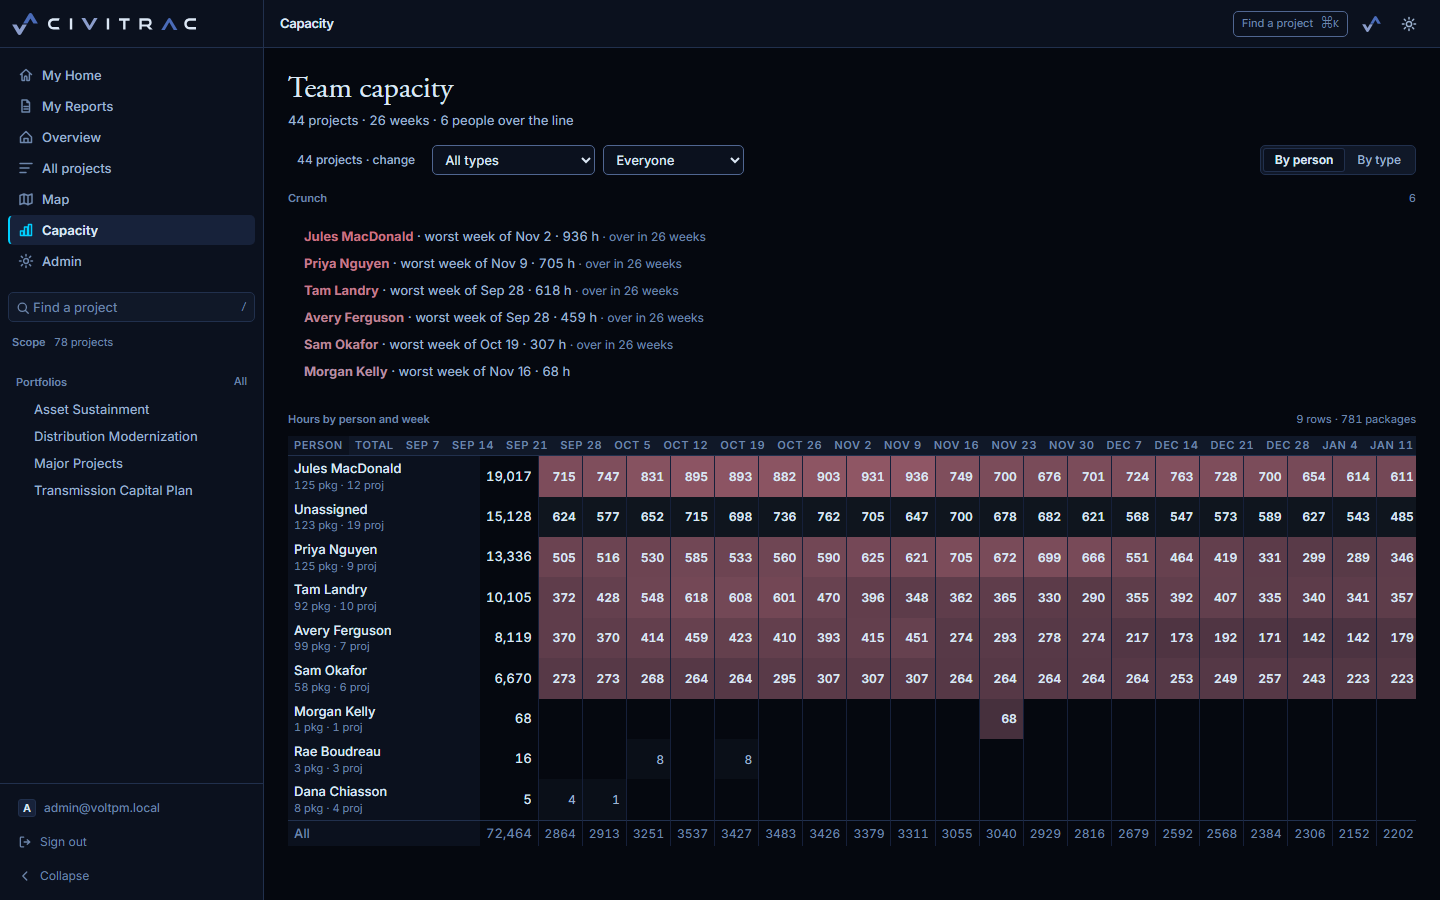
Assignments across the team by week, so the next job goes where there is capacity to take it.
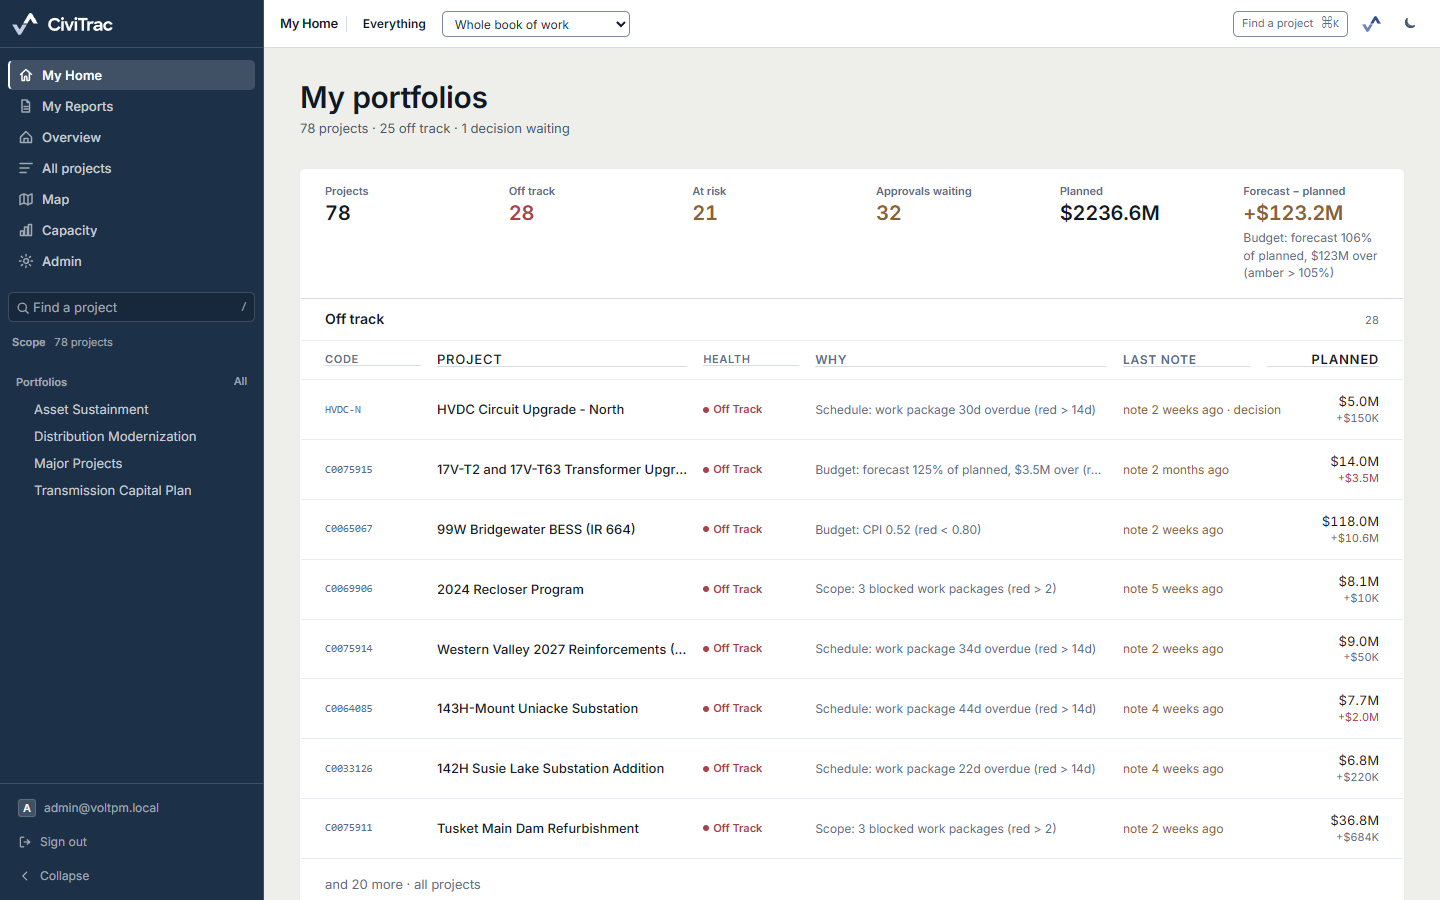
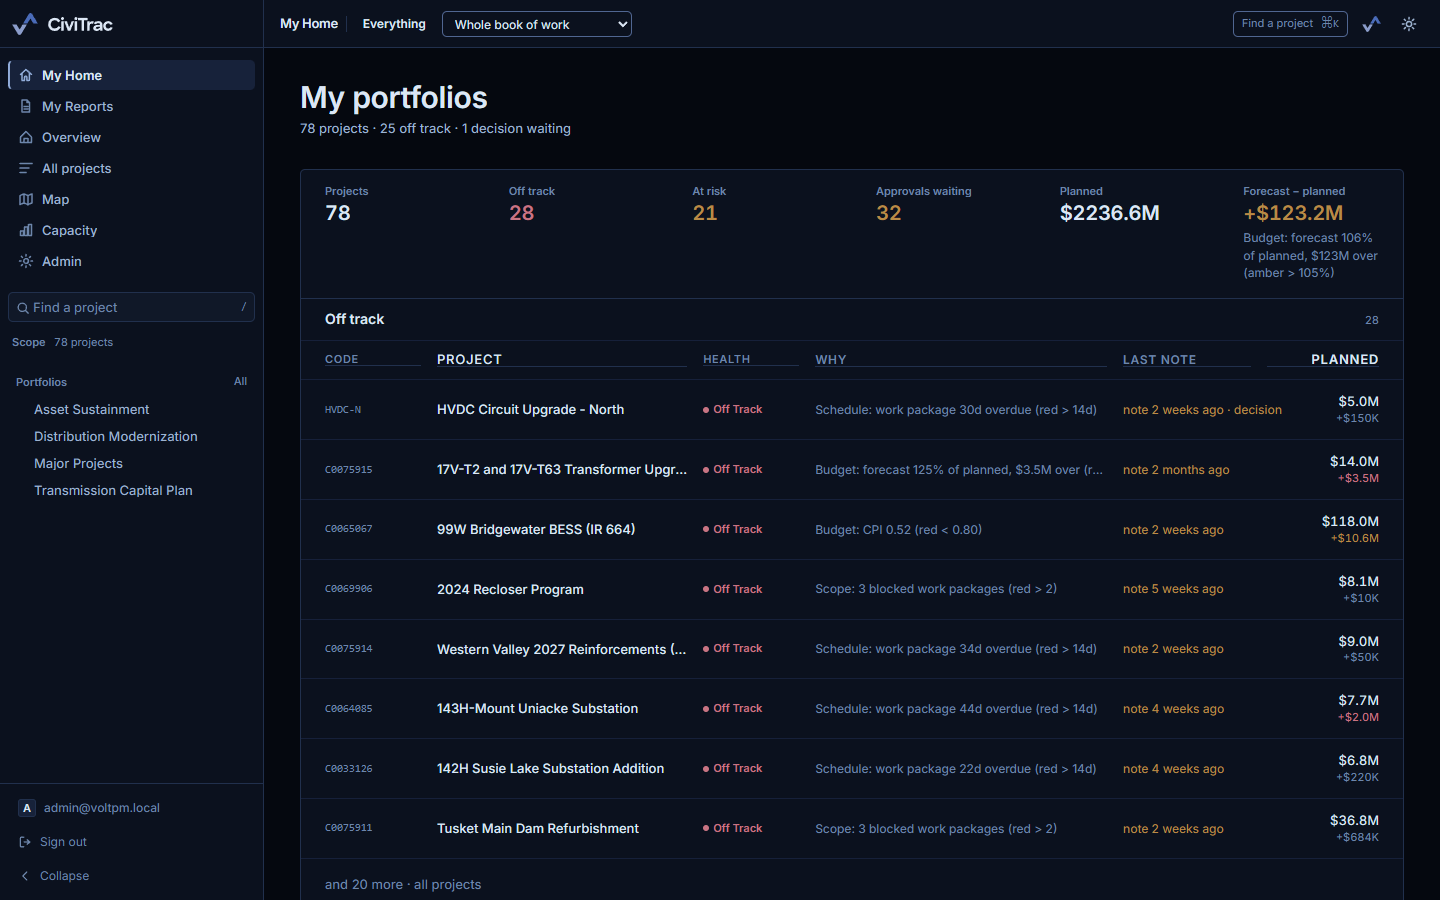
Each manager opens to their own projects, the overdue work, and the decisions waiting on them.
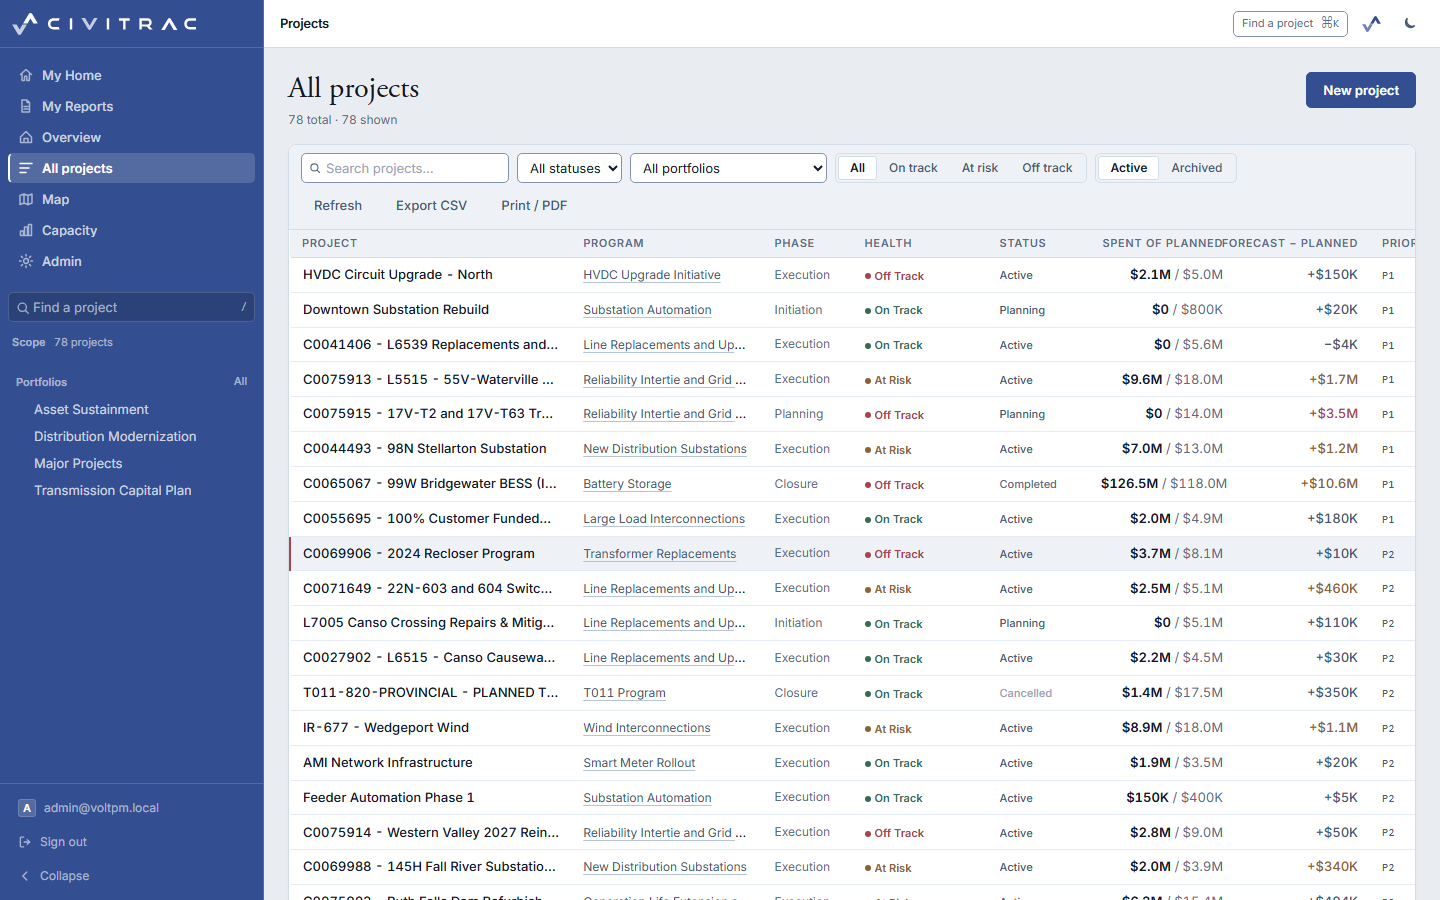
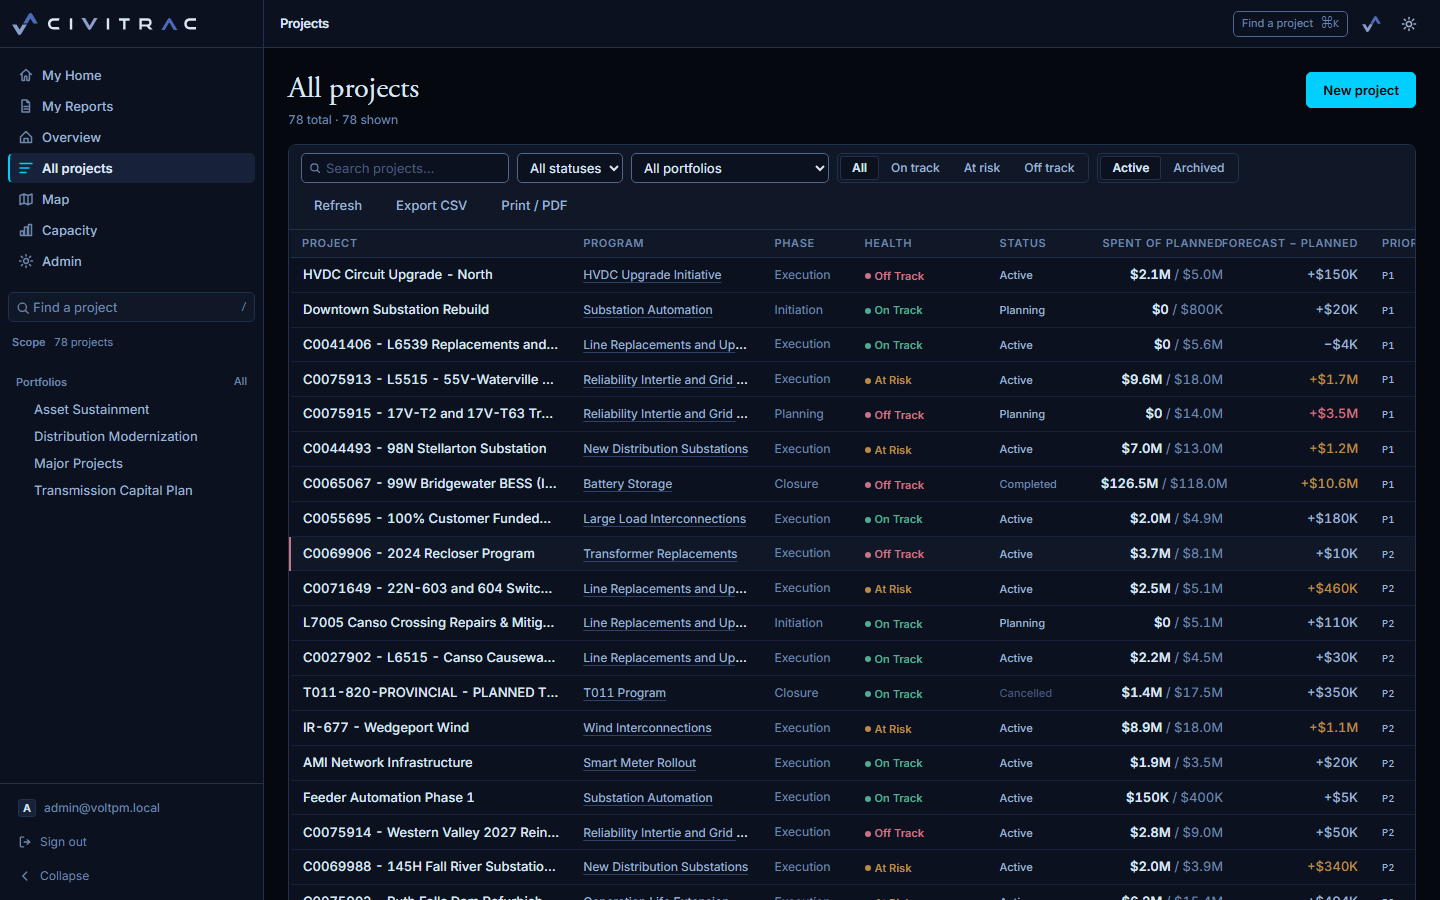
Filter, sort and scan the whole book of work, with health and phase on every row.
Portfolio, program, project, work package: every level rolls up on its own, so a slip on one site shows in the portfolio view before it is a surprise in the field. On track, at risk and off track mean the same thing to a director as to the engineer who flagged it, and the rule that tripped is printed beside the reading.


A register numbered in the owner's own convention. Revisions move through IFR, IFA and IFC, planned issue dates put an overdue count on the project header, and transmittals go out with an acknowledgement link the recipient opens without an account.


Who it is for
Open a project and the strip under the title says what its health is and why: the slip against baseline, the forecast against plan, the age of the last status note. Post the note, flag the decision, re-capture the baseline when the plan changes. The weekly report is written from what you recorded.
Every figure carries who entered it and when.
Every screen here is the sample: an electric utility's major projects, simulated from a public 2026 ten-year system outlook and obfuscated. Its dollars and dates are illustrative, and the screens say so.
What people ask before they ask for a walkthrough. Anything else, write to us.
On Vercel, over a hosted Supabase project: Postgres with row-level security on every table, so a person reads only what their role allows. Sign-in is an email and password on civitrac.com.
An electric utility's major-projects slate, simulated from a public ten-year system outlook and obfuscated. Every dollar and date is illustrative, and the screens say so. Your own slate replaces it.
From the records: slip against the baseline, forecast against plan, and how old the last status note is. Each reading prints the rule that set it. No one picks a project's health.
Every register prints to PDF and exports to CSV. The database is Postgres; nothing is held in a format of its own.
Only what the signed-in person can open. It answers questions over that and writes reports and its own notes for that person, never project data. The model is OpenAI's, called from the server.
No. It is the PM's register: the facts a project manager answers for, with a line on each saying where it came from and when. The systems of record stay where they are. Each system of record connects on its own; until one is connected, its figures are entered in CiviTrac or come from the sample, and the line on each says which.
A walkthrough runs on the sample, or on a portfolio you send ahead so the screens show your projects.